

 English


Mapping Innovation Across the UK: The Leading Areas in 2026
The results at a glance: Our analysis of patent and trademark applications published between October 2025 and October 2026 shows that Cambridge is the UK’s leading location for business innovation when adjusted for population, with 584 applications per 100,000 residents. Stevenage and Oxford follow, while London records by far the highest total volume, with more than 16,000 published patent and trademark applications.
At regional level, Greater London ranks first, accounting for 41% of all applications analysed, while the City of London, Camden, and Westminster lead among London boroughs. Among individual companies, Jaguar Land Rover and Dyson recorded the highest combined totals over the 12-month period.
Table of Contents
- What We Did
- Key Findings
- Cambridge Named the UK’s Most Innovative Business Location
- Greater London is the Leading Region for Business Innovation
- City of London and Camden are London’s Hotpots for Innovative Businesses
- Jaguar and Dyson are the Most Innovative UK Companies of the Past 12 Months
- Methodology
London is widely recognised as the business capital of the UK, but is it the UK’s top hotspot for business innovation? To find out, we did a deep dive into new patent applications and trademarks by UK companies to discover which areas in the UK are driving business innovation.
Patents are rights granted to the owner of an invention. New patent applications help us to research companies who are forming new ideas to create innovative technology or products for example.
A trademark meanwhile is any type of sign (whether a name, a logo, a sound…) that can serve to determine the origin of a certain product or service – in other words, to identify the company behind it. New trademark applications help to identify new brands that have been formed. You can read more about the difference between the two in our post - Patent vs Trademark: What's the Difference?
What We Did
To reveal which places in the UK are the most innovative, we analysed the number of patent and trademark applications accepted and published from the past 12 months against the company's business address. We then calculated the combined total of patent and trademark applications and ranked UK cities and towns, weighted against their local population, by the highest number of combined applications from October 2025-2026. More information about our process can be found in our methodology.
Key Findings
- London is the top area in the UK for total patent and trademark applications, but Cambridge ranks as the top location when weighted by the size of the local population
- Stevenage, Oxford, London, and Coventry also rank in the top five UK hotspots for business innovation
- Greater London is the top region for patent and trademark applications per 100,000 local residents, far ahead of any other region
- City of London, Camden, and City of Westminster are the London boroughs with the most innovative businesses
- Jaguar Land Rover and Dyson recorded the highest number of published patent and trademark applications over the past year.
Cambridge Named the UK’s Most Innovative Business Location
The Top UK Locations Ranked by Patent and Trademark Applications
| Rank | Location | Patent Applications | Trademark Applications | Combined Total | Total per Capita |
|---|---|---|---|---|---|
| 1 | Cambridge | 635 | 251 | 886 | 584 |
| 2 | Stevenage | 31 | 253 | 284 | 311 |
| 3 | Oxford | 217 | 92 | 309 | 184 |
| 4 | London | 2,456 | 13,841 | 16,297 | 178 |
| 5 | Coventry | 394 | 214 | 608 | 165 |
| 6 | Manchester | 114 | 853 | 967 | 164 |
| 7 | Watford | 17 | 141 | 158 | 148 |
| 8 | Nottingham | 125 | 288 | 413 | 125 |
| 9 | Bristol | 297 | 300 | 597 | 121 |
| 10 | Cheltenham | 38 | 103 | 141 | 116 |
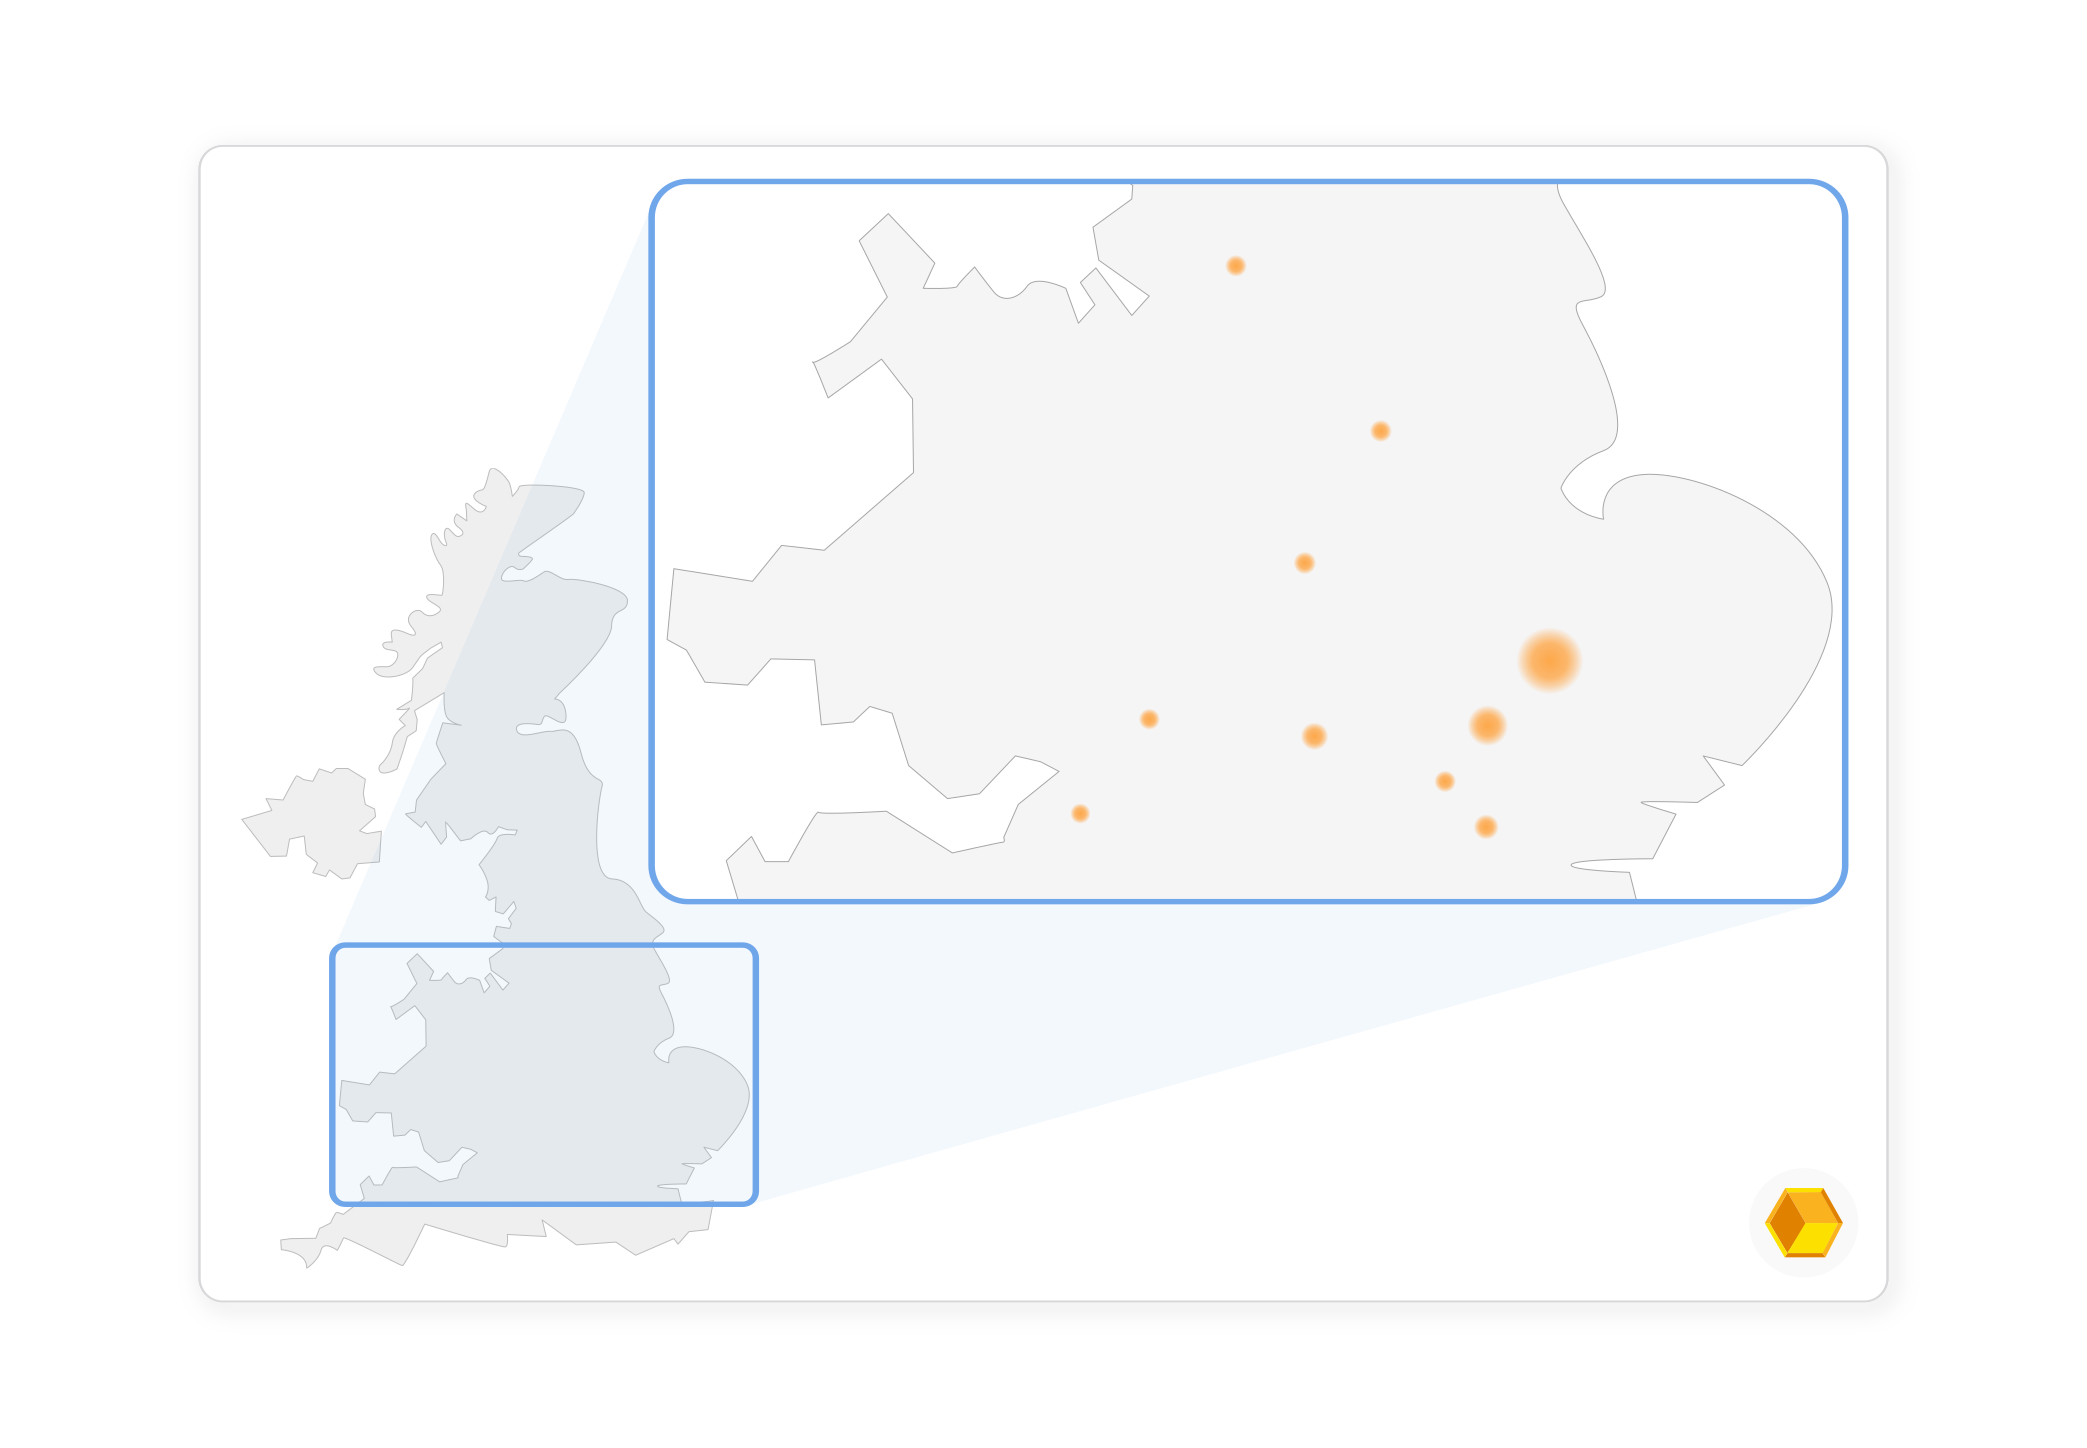
Although businesses with registered office addresses in London had the highest number of published patent and trademark applications in the past 12 months - over 16,000 in total, Cambridge tops our ranking when weighted per 100,000 local residents (per capita) for fairer comparisons. With 584 applications per capita, Cambridge has double the per capita total of every other location bar Stevenage. Cambridge ranks first for patent applications per capita and second for trademarks. The city’s most innovative companies are also quite varied, with 14 individual companies that had over 10 published patent and trademark applications between October 2025 and 2026.
Despite having the smallest population of the top 10 most innovative locations, Stevenage ranks second with 311 applications per capita. Nearly two thirds of the 284 applications come via Glaxo Group Limited - a subsidiary holding company of global biopharmaceutical company GSK plc. Stevenage ranks sixth for patents but first for trademarks, a sign that there are a lot of new brands being formed in the Hertfordshire-based town.
In third place is Oxford, where local businesses had 184 patent and trademark applications published per capita. Only Cambridge has a higher per capita total for patent applications. The 309 total applications come from 97 different companies, showing the high volume of innovative companies based in Oxford.
London (Greater London as a whole) ranks in fourth place on 178 applications per capita. London has by far and away the highest amount of individual applications with 16,297 in total, and still ranks very high even when weighted per capita. London ranks ninth for patent applications per capita, and third on trademarks.
Coventry rounds off the top five with 165 applications per capita, narrowly ahead of Manchester’s 164. Also ranking in the top 10 most innovative locations are Watford (148 per capita), Nottingham (125 per capita), Bristol (121 per capita), and Cheltenham (116 per capita).
Greater London is the Leading Region for Business Innovation
The Top UK Regions Ranked by Patent and Trademark Applications
| Rank | Region | Patent Applications | Trademark Applications | Combined Total | Total per Capita |
|---|---|---|---|---|---|
| 1 | Greater London | 2,637 | 15,154 | 17,791 | 194 |
| 2 | East of England | 1,201 | 2,981 | 4,182 | 64 |
| 3 | North West | 680 | 3,130 | 3,810 | 49 |
| 4 | South East | 1,196 | 3,495 | 4,691 | 49 |
| 5 | South West | 856 | 1,873 | 2,729 | 46 |
| 6 | West Midlands | 737 | 2,060 | 2,797 | 45 |
| 7 | East Midlands | 348 | 1,476 | 1,824 | 36 |
| 8 | Yorkshire and the Humber | 351 | 1,499 | 1,850 | 33 |
| 9 | Scotland | 327 | 1,231 | 1,558 | 28 |
| 10 | Wales | 190 | 660 | 850 | 27 |
| 11 | North East | 117 | 513 | 630 | 23 |
| 12 | Northern Ireland | 86 | 297 | 383 | 20 |
Our study also ranked the 12 UK regions by the number of patent and trademark applications per capita from the past year. London is known as the business capital of the UK and that is evidenced with a applications per capita total of 194 - more than three times the total of the next highest region. During the timeframe analysed, there have been nearly 18,000 patent and trademark applications from London-based companies which accounts for 41% of all applications, and more than the total for the regions ranked 4-12 combined.
The region with the second highest density of innovative businesses is the East of England. The East is one of only three regions with over 4,000 total patent and trademark applications and has a per capita total of 64.
In third place is the North West with over 3,800 applications and 49 per capita, narrowly ahead of the South East in fourth which is also on 49 due to rounding. The South West completes the top five on 46 applications per capita. Northern Ireland is the weakest region with 20 per capita.
City of London and Camden are London’s Hotpots for Innovative Businesses
The Top London Boroughs Ranked by Patent and Trademark Applications
| Rank | Borough | Patent Applications | Trademark Applications | Combined Total | Total per Capita |
|---|---|---|---|---|---|
| 1 | City of London | 76 | 794 | 870 | 5,614 |
| 2 | Camden | 482 | 3,326 | 3,808 | 1,727 |
| 3 | City of Westminster | 750 | 2,537 | 3,287 | 1,524 |
| 4 | Islington | 346 | 2,127 | 2,473 | 1,093 |
| 5 | Hackney | 272 | 1,836 | 2,108 | 785 |
| 6 | Tower Hamlets | 59 | 467 | 526 | 156 |
| 7 | Hammersmith and Fulham | 61 | 228 | 289 | 151 |
| 8 | Kensington and Chelsea | 29 | 193 | 222 | 151 |
| 9 | Enfield | 187 | 187 | 374 | 113 |
| 10 | Southwark | 23 | 237 | 260 | 82 |
With Greater London ranking as the top region for business innovation, we also researched which London boroughs had the highest number of patent and trademark applications per capita. The City of London comes out on top with 870 total applications and 5,614 per capita. This is somewhat inflated due to the City of London having a high ratio of businesses to local population which impacts their per capita figure. The 870 applications come from 450 unique companies.
Companies with registered office addresses in Camden have produced the highest number of total patent and trademark applications, giving them the second highest per capita total of 1,727. The 3,808 applications come from 2,567 companies whose company address is located in Camden. 14 of these companies had 10+ published patent or trademark applications.
The third highest per capita total belongs to the City of Westminster. Companies situated in the City of Westminster have the second highest number of total applications at 3,287 which gives them a per capita figure of 1,524. Of the 1,663 Westminster-based companies with at least one published application, 25 have had 10 or more published applications in the last 12 months.
Islington and Hackney are the only other boroughs with over 2,000 applications for patents and trademarks (only one other borough has 500+). Islington ranks fourth with 1,093 per capita, followed by Hackney in fifth place at 785. 79% of all applications for London-based companies are from businesses situated in these five boroughs, which also make up the top five when looking at both patents and trademarks on their own.
Jaguar and Dyson are the Most Innovative UK Companies of the Past 12 Months
The Top Companies Ranked by Patent and Trademark Applications
| Rank | Company | Location | Patent Applications | Trademark Applications | Combined Total |
|---|---|---|---|---|---|
| 1 | Jaguar Land Rover Limited | Coventry | 370 | 12 | 382 |
| 2 | Dyson Technology Limited | Malmsesbury | 243 | 15 | 258 |
| 3 | Nicoventures Trading Limited | City of Westminster | 235 | 0 | 235 |
| 4 | Glaxo Group Limited | Stevenage | 0 | 201 | 201 |
| 5 | Parabellum IP Holdings Limited | Enfield | 170 | 0 | 170 |
| 6 | Rolls-Royce plc | Islington | 138 | 0 | 138 |
| 7 | Frontier Physics Ltd | Dorchester | 0 | 122 | 122 |
| 8 | Nxera Pharma UK Limited | Cambridge | 113 | 0 | 113 |
| 9 | MICKAI LTD | Hackney | 105 | 0 | 105 |
| 10 | BAE Systems plc | City of Westminster | 92 | 8 | 100 |
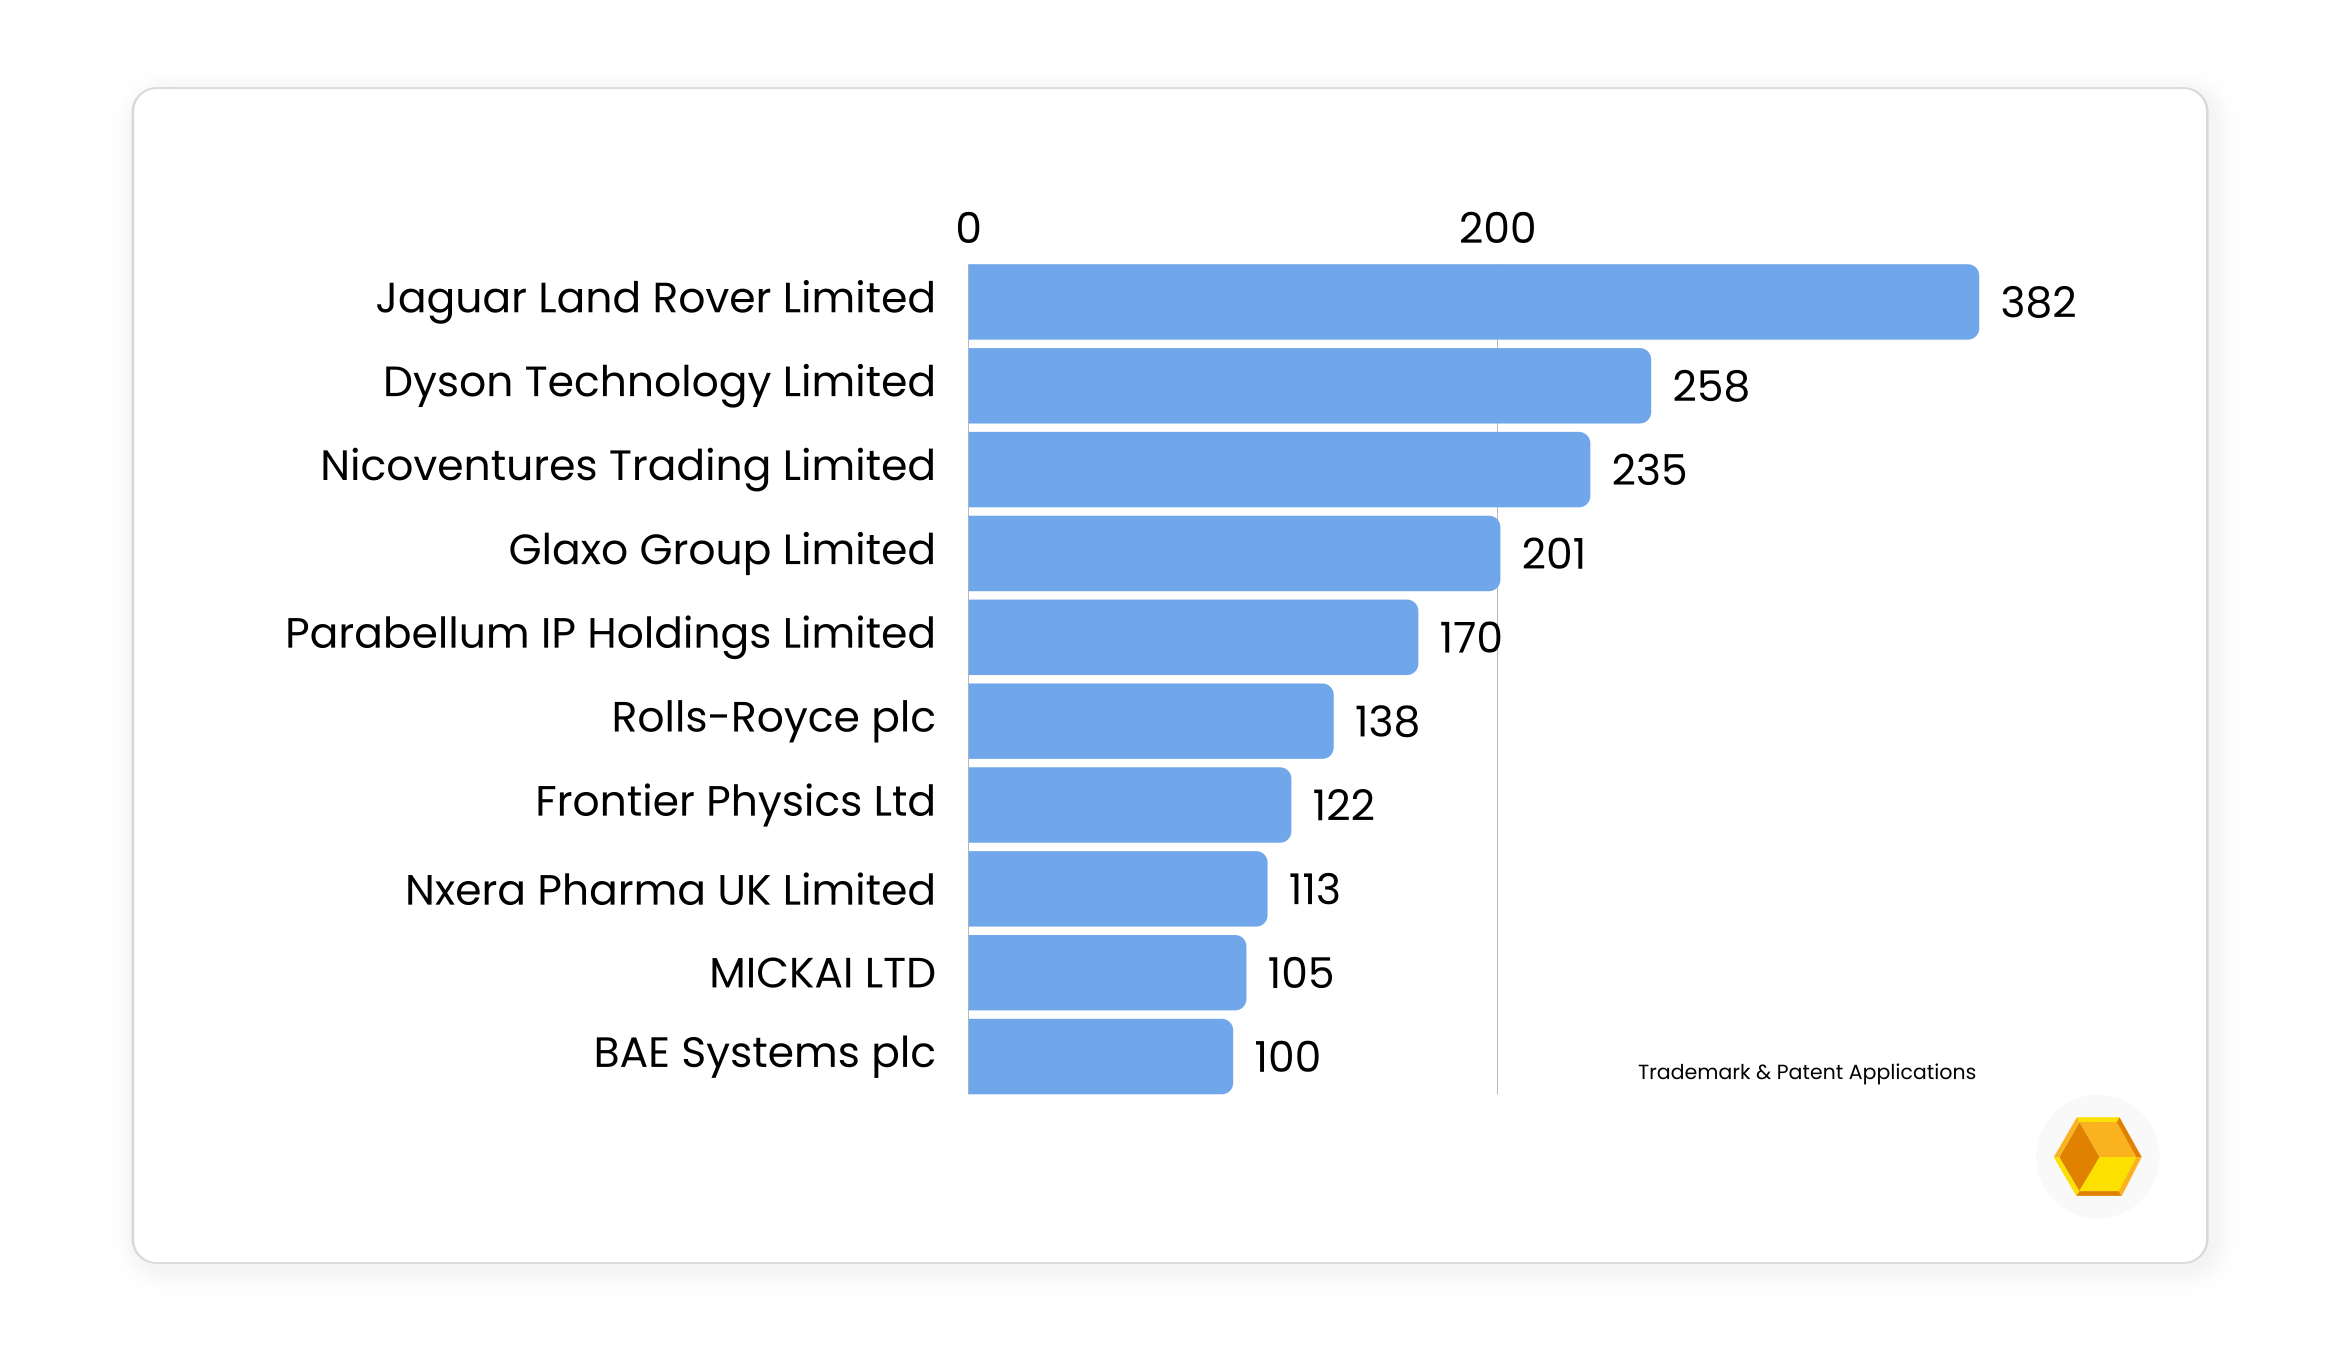
Finally, our study also revealed the most innovative UK-based companies of the past 12 months based on patent and trademark applications. Jaguar Land Rover Limited, whose headquarters are based in Coventry, topped the rankings for the most innovative companies with 370 published patent applications, in addition to 12 published trademark applications, for a combined total of 382.
They are followed in second place by another historic British brand that continues to innovate - Dyson Technology Limited. Dyson had 243 published patent applications and 15 published trademark applications in the past year - 258 in total. Dyson accounts for nearly 10% of the patent and trademark applications from companies based in the South West.
Nicoventures Trading Limited ranks third and is the most innovative London-based company. The British American Tobacco subsidiary had 235 published patent applications in the last year.
They are followed in fourth place by Glaxo Group Limited. The Stevenage based company is a R&D-linked subsidiary of biopharmaceutical company GSK plc. They had 201 published trademark applications.
The top five most innovative companies are rounded off by Parabellum IP Holdings Limited. The London-based intellectual property consultancy and strategy firm had 170 published patent applications in the past 12 months.
Also among the top 10 UK-based companies for innovation are Rolls-Royce plc (138 new applications), Frontier Physics Ltd (122), Nxera Pharma UK Limited (113), MICKAI LTD (105), and BAE Systems plc (100).
Methodology
To reveal which places in the UK are the most innovative, we analysed patent applications published by the UKIPO and trademark applications accepted and published in the Trade Marks Journal over the past 12 months against the companies’ business addresses.
Patent applications were sourced from https://www.gov.uk/search-for-patent and cover the time period of October 13th 2025 - October 12th 2026
Trademark applications were sourced from https://www.ipo.gov.uk/t-tmj/t-tmj-previous.htm and cover the time period of journals published on October 17th 2025 - October 9th 2026
The sum of the patent and trademark applications for each listed owner were then combined to create a combined total.
We then used Companies House to look up the registered office address for each patent and trademark application owner. Owners without a listed address were then omitted. This removed individuals not registered as companies, as well as owners based outside of the United Kingdom. Companies with a Companies House status that wasn't "Active" were also omitted. After these were removed this left 43,095 applications from 18,643 unique owners where the Companies House address was analysed.
The city/town, London borough, county, and region were then extracted from each company address in order to rank each by the total sum of patent and trademark applications. Finally, for fair comparisons between different places we weighted the number of patent and trademark applications by the local population for a per capita total (per 100,000 local population). Local population figures were sourced from the Estimates of the population for the UK, England, Wales, Scotland, and Northern Ireland
Towns not included as a unitary authority, council area, or non-metropolitan district by ONS data were excluded from regional rankings. “London” refers to Greater London rather than just the City of London.
Data correct as of October 2026.


